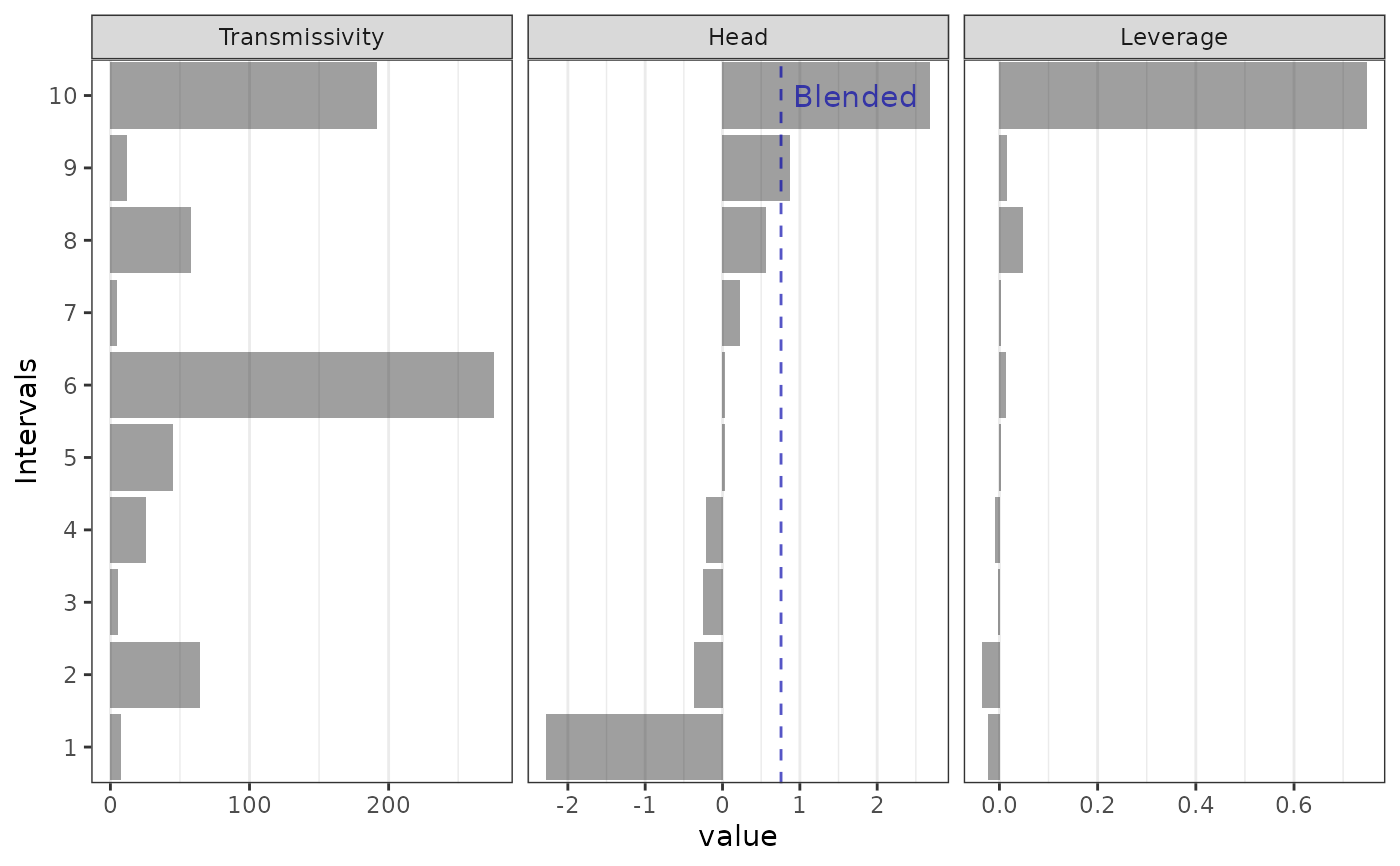
`plot_blended` takes a vector of transmissivity and a vector of hydraulic head and calculates the expected blended head for a cross-connected well and returns a ggplot2 object. The length units for transmissivity and hydraulic head should be the same.
plot_blended(transmissivity, head)
Arguments
| transmissivity | the transmissivity distribution for each interval |
|---|---|
| head | the head distribution for each interval |
Value
a ggplot of the transmissivity and head
Details
The plotting function usese `estimate_blended_head` to calculate the blended head value. The blended head is plotted with a dashed line.
References
Sokol, D. (1963). Position and fluctuations of water level in wells perforated in more than one aquifer. Journal of Geophysical Research, 68(4), 1079-1080.
See also
Other blended head methods:
blended_head_change(),
estimate_blended_head(),
estimate_formation_head(),
estimate_missing()
Examples
transmissivity <- abs(rnorm(10, sd = 100))       # random T distribution
head <- sort(rnorm(10))                          # decreasing head with depth

plot_blended(transmissivity, head)