Contaminant transport steps
transport.Rmd
library(hydrorecipes)
#> Loading required package: Bessel
library(ggplot2)
library(scales)
library(data.table)
!!!!!!!!!!!UNDER DEVELOPMENT!!!!!!!!!!!!!!!
Sudicky and Frind 1982 dual fractures (solute)
dat <- collapse::qDT(expand.grid(c(1:180) * 86400,
                                 c(1, 50, 100),
                                 c(0.0, 0.05, 0.1, 0.15, 0.2, 0.25, 0.5)))
names(dat) <- c('t', 'z', "x")

cra_sol <- recipe(t~., dat) |>
  step_transport_fractures_solute(time = t,
                                  distance_fracture = z,
                                  distance_matrix = x,
                                  concentration_influent = 0.0,
                                  time_influent = 0.0,
                                  concentration_initial = 1.7e7,
                                  fracture_aperture = 2.5e-4,
                                  fracture_spacing = 1.0,
                                  velocity = 0.004,,
                                  dispersivity_longitudinal = 0.1,
                                  diffusion = 1.6e-8,
                                  sorption_fracture = 0.0,
                                  sorption_matrix = 0.0,
                                  decay = 1e15, # no decay
                                  density_bulk = 2.6 * 1e3,
                                  porosity = 0.06,
                                  tortuosity = 0.1,
                                  n_terms = 30L) |>
  plate("dt")

cra_sol[, z := factor(paste(z, "m"), levels = c("1 m", "50 m", "100 m"))]
ggplot(cra_sol, aes(x = t/86400, y = transport_fractures_solute, color = as.factor(x), group = as.factor(x))) +
  geom_line(linewidth = 1) +
  guides(color=guide_legend(title="To Fracture (m)")) +
  scale_y_log10(limits = c(1e3, 2e7),
                expand = c(0,0),
                breaks = scales::trans_breaks("log10", function(x) 10^x),
                labels = scales::trans_format("log10", scales::math_format(10^.x))) +
  facet_wrap(z~., ncol = 4) +
  ylab("Concentration (ug/m3)") +
  xlab("Time (days)") +
  annotation_logticks(sides="lr") +
  ggtitle("Fracture spacing = 1 m, Fracture aperture = 250 μm") +
  theme_bw() +
  theme(text = element_text(size=20),
        panel.grid.minor.y = element_blank())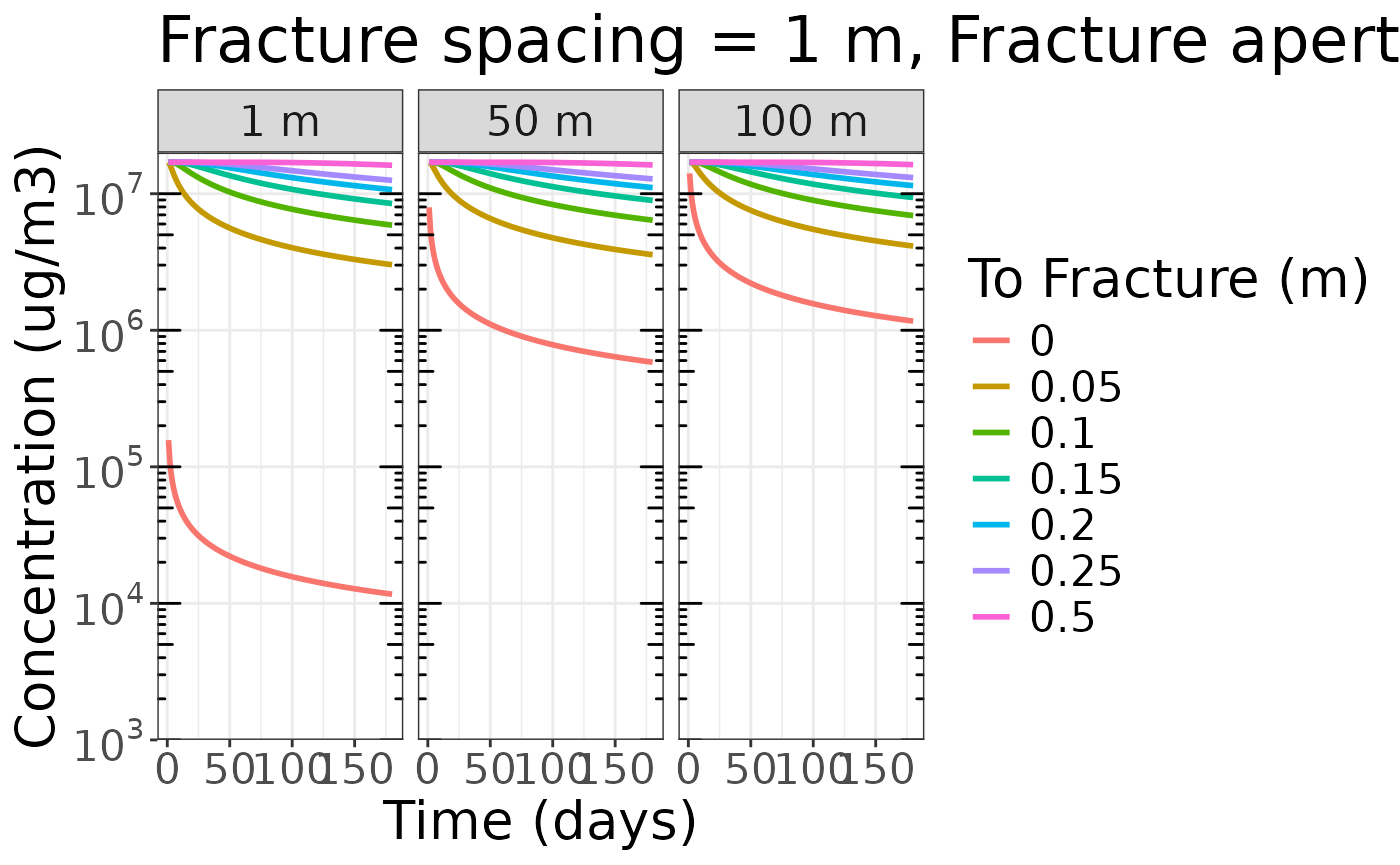
Sudicky and Frind 1982 dual fractures (modified for heat)
dat <- collapse::qDT(expand.grid(c(1:180) * 86400,
                                 c(1, 2, 5),
                                 seq(0, 2, 0.5)))
names(dat) <- c('t', 'z', "x")

cra_heat <- recipe(time~., dat) |>
  step_transport_fractures_heat(time = t,
                                distance_fracture = z,
                                distance_matrix = x,
                                temperature_influent = 15.0,
                                time_influent = 0.0,
                                temperature_initial = 10,
                                fracture_aperture = 2.5e-4,
                                fracture_spacing = 10.0,
                                velocity = 0.004,
                                thermal_conductivity_water = 0.615,    # W / (m * K)
                                thermal_conductivity_solids = 3.4,     # W / (m * K)
                                specific_heat_water = 4192,            # J/(kg*K)
                                specific_heat_solids = 908,            # J/(kg*K)
                                density_water = 1.0 * 1e3,             # kg / m3
                                density_solids = 2.5 * 1e3,            # kg / m3
                                porosity = 0.1,
                                n_terms = 30L) |>
  plate("dt")

cra_heat[, z := factor(paste(z, "m"), levels = c("1 m", "2 m", "5 m"))]
ggplot(cra_heat, aes(x = t / 86400,
                     y = transport_fractures_heat,
                     color = as.factor(x),
                     group = as.factor(x))) +
  geom_line(linewidth = 1) +
  guides(color=guide_legend(title="To Fracture (m)")) +
  facet_wrap(z~., ncol = 4) +
  ylab("Concentration (ug/m3)") +
  xlab("Time (days)") +
  annotation_logticks(sides="lr") +
  ggtitle("Fracture spacing = 1 m, Fracture aperture = 250 μm") +
  theme_bw() +
  theme(text = element_text(size=20),
        panel.grid.minor.y = element_blank())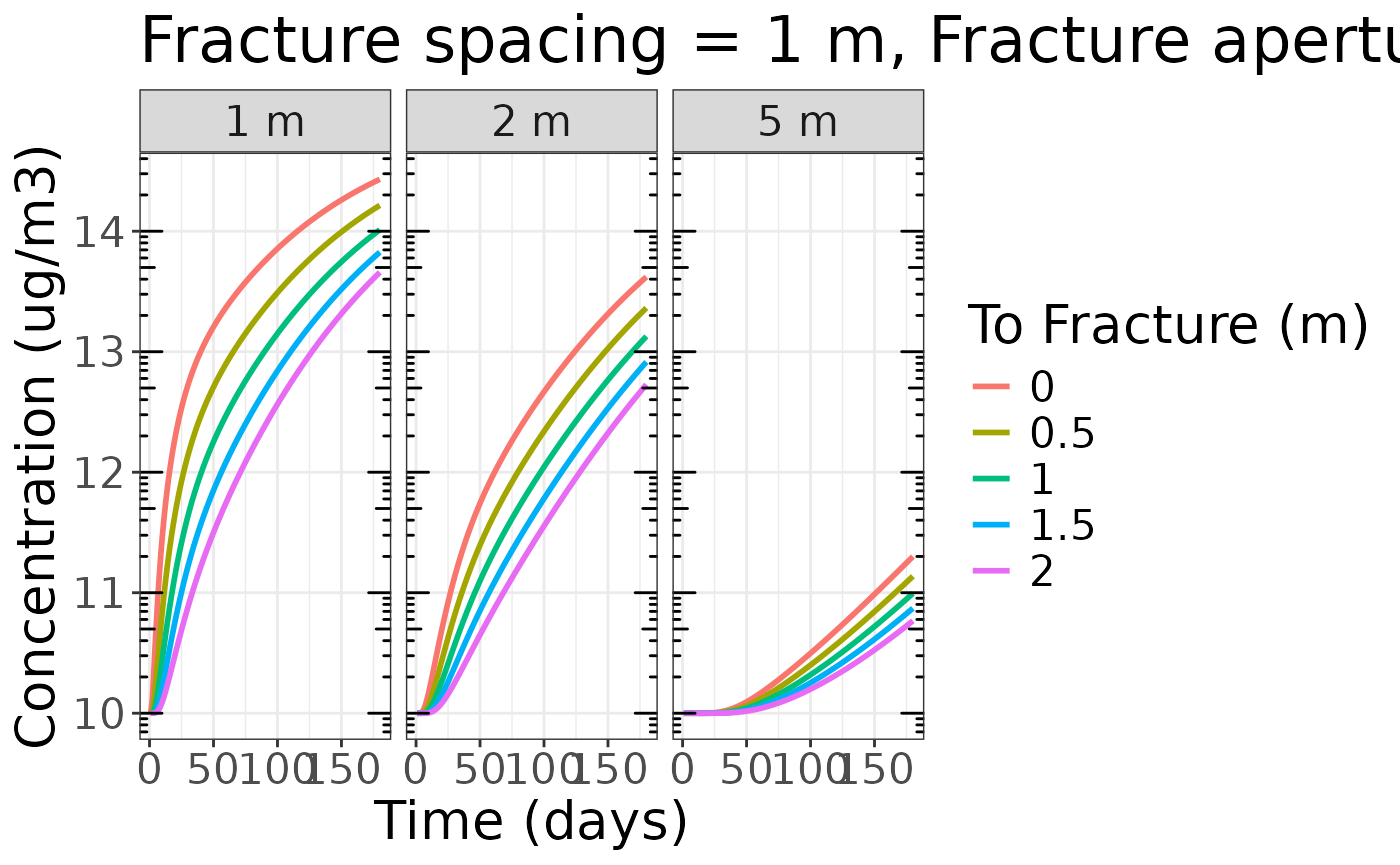
Ogata and Banks 1962 1-D transport with decay and retardation
distance (vector) time (vector)
dat <- expand.grid(seq(0, 22, 0.1),
                   seq(0, 20, 0.1))
dat <- collapse::qDT(dat)
setnames(dat, c("distance", "time"))
ob <- recipe(time~., data = dat) |>
  step_transport_ogata_banks(time = time,
                             distance = distance,
                             concentration_initial = 1.0,
                             velocity = 1.0,
                             diffusion = 1e-1,
                             retardation = 1.0,
                             decay = 0.0) |>
  plate()


ggplot(ob, aes(x = distance, y = time)) +
  geom_raster(aes(fill = transport_ogata_banks)) +
  scale_fill_gradient("Concentration") +
  scale_x_continuous(expand = c(0, 0)) +
  scale_y_continuous(expand = c(0, 0)) +
  theme_bw()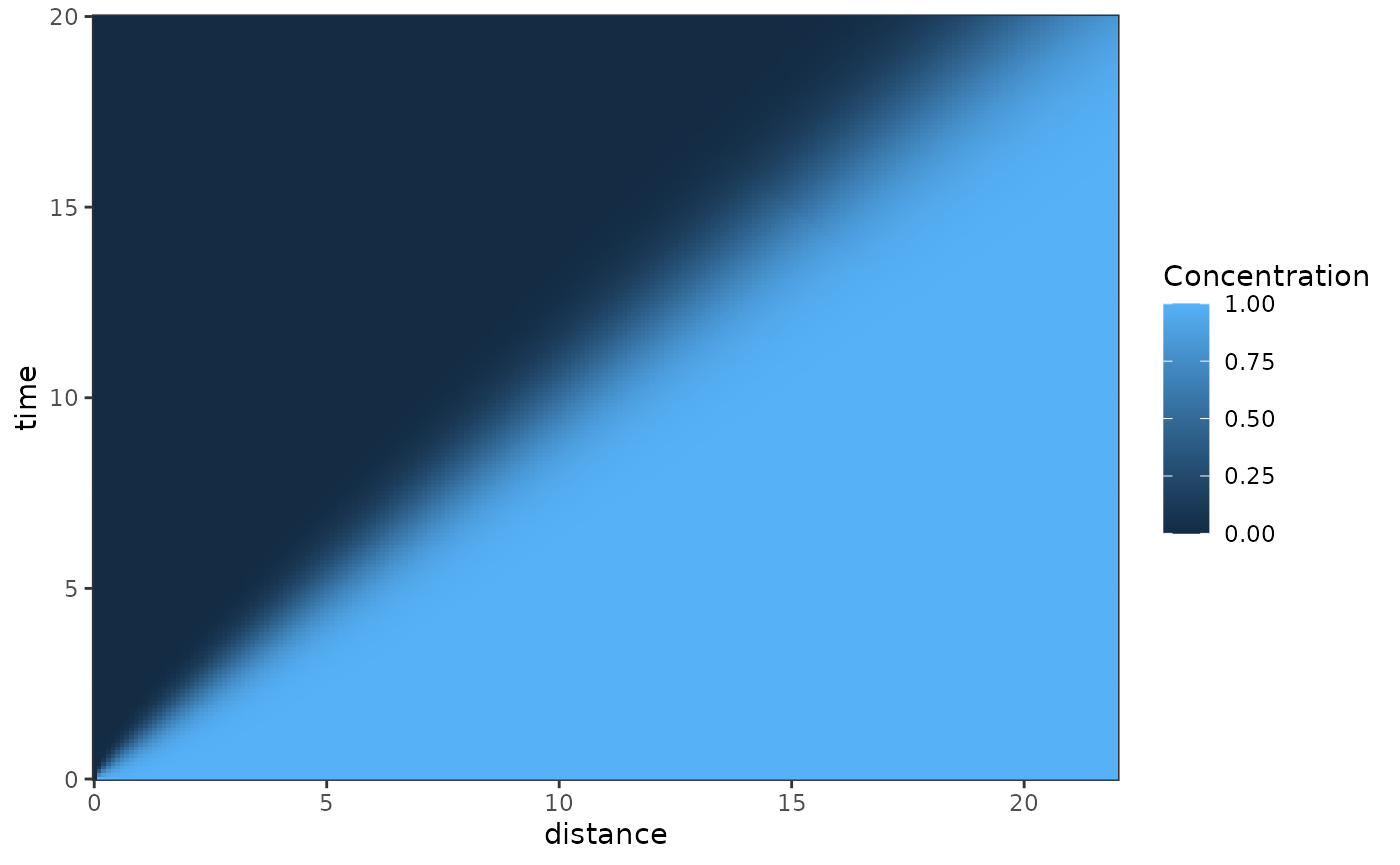
Heatmap of concentration as a function of distance from a constant source and time. Concentrations increase with increasing time and decreasing distance.